Finding Python Memory Leaks Using Meliae
When working on the Tribler project as part of my master thesis, I was asked to investigate a memory issue. Tribler allows people to share content in a fully decentralized way and implements a Tor-like protocol that can be used to download content anonymously. By proxying traffic through other nodes, the anonymity of Tor is obtained. You can start a Python script that allows your computer to become a proxy for other users in the network. However, when running this tool for a longer period (a few days), the memory becomes filled with objects, eventually crashing the program because it runs out of memory.
To get me started, I was provided with several memory dumps from Python programs that have been running for different amount of times (up to 13 hours). These dumps have been created using meliae. Meliae can be used to dump memory to a file and provides some tools tool investigate these dumped files. A meliae files looks like this:
{"address": 140478590600416, "type": "str", "size": 41, "len": 4, "value": "main", "refs": []}
{"address": 140478718917648, "type": "EggInfoDistribution", "size": 64, "refs": [140478718970688, 35134224]}
{"address": 9414496, "type": "type", "size": 904, "name": "object", "refs": []}
{"address": 140478727533464, "type": "dict", "size": 3352, "len": 36, "refs": [140478729927344, 140478727576104, 140478730052640]}
As you can see, each line represents a Python object in memory, formatted as JSON. The address, type, size in memory, length, references to other objects and an optional value are visible. When dealing with large files ten thousand lines of code, it is unfeasible to manually look at the entries. Fortunately, meliae provides some great tools to parse and visualize the data!
Meliae makes it possible to print an overview of the distribution of objects, based on type. We can do this with the following Python code:
1
2
3
4
5
6
7
8
 from meliae import loader
om = loader.load("my_memory_file.out")
om.collapse_instance_dicts()
om.compute_referrers()
om.remove_expensive_references()
om.guess_intern_dict()
s = om.summarize()
print s
This will output something like the following:
Total 584629 objects, 629 types, Total size = 57.7MiB (60552402 bytes)
Index Count % Size % Cum Max Kind
0 222 0 12391984 20 20 4194536 frozenset
1 11393 1 10516760 17 37 196888 dict
2 392017 67 9408408 15 53 24 int
3 73858 12 6097030 10 63 65573 str
4 792 0 2448000 4 67 196944 module
5 25303 4 1895680 3 70 80056 tuple
6 1999 0 1807096 2 73 904 type
7 14679 2 1761480 2 76 120 function
8 13641 2 1746048 2 79 128 code
9 1047 0 1164264 1 81 1112 Id
10 1035 0 1150920 1 83 1112 Member
11 598 0 1061568 1 84 196896 collections.defaultdict
12 2376 0 905536 1 86 131304 set
13 2337 0 803928 1 87 344 StringifiableFromEvent
14 5456 0 592816 0 88 13224 list
15 361 0 401432 0 89 1112 Method
16 3968 0 349184 0 90 88 weakref
17 257 0 285784 0 90 1112 RoutingNode
18 895 0 252356 0 90 9124 unicode
19 695 0 244640 0 91 352 EC_pub
The output above is a parsed memory dump from a tunnel script that has been running for two hours. As we see, there are 222 frozenset objects in memory, responsible for 20% of the memory usage. Dictionaries are taking 17% of the memory. To find out which kind of object is causing the memory leak, we run the loader tool again on the dump from a longer run (only the four type of objects are visible that contribute most to the memory usage):
Total 786833 objects, 638 types, Total size = 113.7MiB (119259945 bytes)
Index   Count   %      Size   % Cum     Max Kind
     0   41202   5  41953200  35  35  196888 dict
     1     222   0  12391984  10  45 4194536 frozenset
     2  133092  16  10226137   8  54   65573 str
     3  414492  52   9947808   8  62      24 int
The amount of dictionaries in this dump is significant larger than our previous dump! Somehow, there must be some dictionaries that are not removed by our garbage collector.
To get a bit more insight in the increase of memory, I plotted the amount of dict objects in memory against the run time of the program:
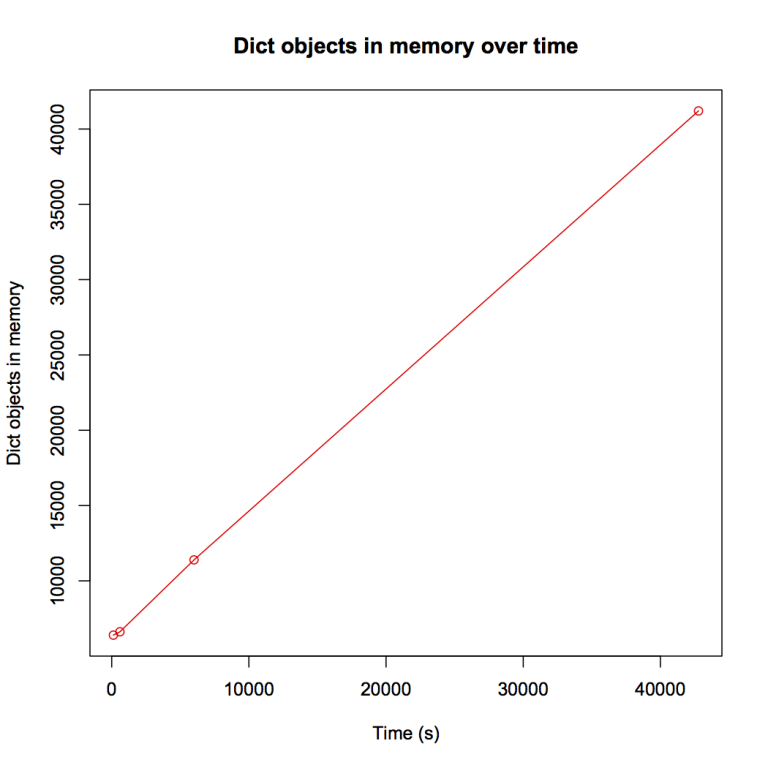
Apparently, the number of dictionaries in memory is increasing very linear over time.
To get more information about the specific dictionaries that are causing havoc, I decided to get all dictionaries in the dump with lower running time and the dictionaries in the dump with a longer running time. Next, I filtered out all dictionaries that are only present in the dump with longer running time. These dictionary objects have been created for sure during the time of the two memory dumps. I’ve written the following small Python script to do this:
1
2
3
4
5
6
7
8
9
10
11
12
13
14
15
16
17
18
19
20
21
22
 from meliae import loader

def get_dicts(file_name):
om = loader.load(file_name)
om.collapse_instance_dicts()
om.compute_referrers()
om.remove_expensive_references()
om.guess_intern_dict()
return om.get_all('dict')

dicts_600 = get_dicts("memory-600.00.out")
dicts_6000 = get_dicts("memory-6000.00.out")

set_addresses_600 = set()
for item in dicts_600:
set_addresses_600.add(item.address)

# find dictionaries in set_addresses_600 but not in
diff_list = []
for item in dicts_6000:
if item.address not in set_addresses_600:
diff_list.append(item)
diff_list now contains all dictionaries that have been added between the time of dumps of the two files. Let’s get some more information about the specific dictionary objects:
>>> print len(diff_list)
4874
>>> diff_list[300]
dict(140478455628136 1048B 24refs 1par)
>>> diff_list[800]
dict(140478457973568 1048B 24refs 1par)
>>> diff_list[1350]
dict(140478459290240 1048B 24refs 1par)
Interesting, these dictionary objects are very similar. We can print all the references of a specific object:
>>> diff_list[300].refs_as_dict()
{'message"': tuple(140478449713488 64B 1refs 2par), 'log_text"': 'Stopping protocol <Tribler.community.tunnel.tunnel_community.TunnelExitSocket instance at 0x7fc3ba8d"', 'system"': '-"', 'log_namespace"': 'log_legacy"', 'format"': '%(log_legacy)s"', 'isError"': 0, 'log_level"': NamedConstant(140478715765776 344B 7refs 100par), 'log_format"': '{log_text}"', 'log_legacy"': StringifiableFromEvent(140478109273360 344B 3refs 1par), 'log_system"': '-"', 'log_time"': float(140478327820632 24B 2par), 'time"': float(140478327820632 24B 2par)}
So this is the actual content of the dictionary. It appears to be some kind of logging entry. We can see which object is referencing the dictionary object above:
>>> diff_list[300].p
[collections.deque(140478716210768 20080B 2337refs 1par)]
Our log entries seems to appear in a list. Moreover, we see that there are 2337 items in this list. Let’s see which object is pointing to the list above:
>>> diff_list[300].p[0].p
[LimitedHistoryLogObserver(140478715938064 344B 3refs 2par)]
Now things get interesting. The LimitedHistoryLogObserver is part of the Twisted framework we are using to implement asynchronous programming. Our log gets filled with log messages. These log messages are generated when an event happens in Twisted (for instance, when we start or stop listening on a specific port).
At this point, I started to search on the internet to find any issues with the LimitedHistoryLogObserver. I found this issue in which the same issue is addressed. A workaround for the LimitedHistoryLogObserver getting filled with log messages can be found here. Seems that our observer is not really that limited :)
Meliae contains many more tools to investigate objects and get more interesting information:
>>> dir(diff_list[300])
['__class__', '__delattr__', '__doc__', '__format__', '__getattribute__', '__getitem__', '__hash__', '__init__', '__len__', '__new__', '__reduce__', '__reduce_ex__', '__repr__', '__setattr__', '__sizeof__', '__str__', '__subclasshook__', '_intern_from_cache', 'address', 'all', 'c', 'children', 'compute_total_size', 'iter_recursive_refs', 'num_parents', 'num_referrers', 'num_refs', 'p', 'parents', 'ref_list', 'referrers', 'refs_as_dict', 'size', 'to_json', 'total_size', 'type_str', 'value']
Meliae can also be combined with other tools such as objgraph. Objgraph can generate graphs that show references between objects. In my next blog post, I will write more about this tool. I hope you enjoyed this blog post and if you have any comments or questions, please let me know.
Enjoy Reading This Article?
Here are some more articles you might like to read next: